

After a growth-driven website redesign, you can't just "Set it and Forget It" anymore!
In the "good old days," websites were relatively static. A company might spend many months--sometimes even a year or more--on a website redesign, get everything perfect (or what seemed perfect), and leave it alone for several years until it is time for a new look. Today, a website redesign strategy is somewhat different.
 Web Design Model" style="height: auto; max-width: 100%; width: 800px; display: block;">
Alas, your website is NOT a rotisserie chicken. This "set it and forget it approach" simply isn't enough anymore for multiple reasons:
Websites have become more than online brochures: For many years, websites mainly existed as online brochures. People could visit your site, read about your company, and pick up the phone to call you. Now, our websites can be complex, robust lead-generation tools that support and enhance your sales team's efforts.
Consumer expectations have changed: Just as the role of websites has changed, so have customer expectations. Fifteen years ago, people wouldn't have imagined that most of their banking could (and would) be done online without visiting a bank. Today, about 80% of people prefer to bank exclusively online. The implication? Your company's website should facilitate self-service as much as possible--and deliver an exceptional user experience.
Your business and industry are constantly evolving: From changing market conditions to disruptive technology or emerging competitors, your business must constantly adapt to account for new factors. Your website must also evolve to reflect your response to these challenges.
This is why we've overwhelmingly seen (and always recommend) a shift from traditional website development to a growth-driven design (GDD) methodology. This approach ensures that your website functions as a "virtual member" of your marketing and sales team, driving leads, making conversions easier, and helping your company reach its growth goals.
Performance Metrics to Track after Your Growth-Driven Website Redesign
With the growth-driven design methodology, the real work begins after launch. That's when you must be super attuned to your website performance. That data should drive all subsequent website redesign decisions, from the new pages you add, to where you place CTAs and even the fields you include on different website forms.
Not sure where to start and which metrics to track? These six metrics will give you much of the data you need to make growth-driven design decisions.
1. Overall Site Traffic
We tend to think of website design as a matter of aesthetics, even in the context of increasing conversions. For instance, we might think about changing the position or color of a button to get more clicks.
SEO should figure prominently into your growth-driven design strategy. At the very least, each new web page you create should be built around a specific keyword with sufficient search volume relevant to your buyer personas.
If you've thoughtfully considered SEO in your growth-driven design, you should see increased organic traffic over time. No traffic bump? Maybe it's time to reconsider
2. Site Bounce Rate
Bounce rate essentially measures how long visitors stay on your website. A high bounce rate translates into a shorter visit, while a low bounce rate means people tend to stick around, indicating greater engagement. Sometimes, a high bounce rate might be expected (for instance, on your home page). But in most cases, a lower bounce rate is better.
What, exactly, is a "good" bounce rate? That depends. But according to SEMRush, the average bounce rate is 44-50%, and a good bounce rate would be 26-40%.
Multiple factors can contribute to high bounce rates:
Slow page load time: No one wants to wait for your website to load--particularly if they're visiting on a mobile device. Pages should take no more than three seconds to load, even that's a long time by today's standards.
Awkward site navigation: Getting around your website--including searching the site--should be easy and intuitive. If visitors can't easily find what they're looking for, they'll move on quickly. More complex sites might need additional navigation cues (such as breadcrumbs) to help visitors get around more easily.
Unengaging content: Perhaps the content isn't what the visitor expected, or maybe it's just not interesting or informative enough. If people are disappointed in the quality of your content, they'll often seek another source.
Long blocks of text: Let's face it: most online readers are looking for a good skim. Studies show that even people with advanced degrees still prefer to consume online content written at the 6th- to 9th-grade reading level (even if they're reading about something in their field). Long blocks of text can be intimidating, making it very difficult to find the information they're looking for.
Lack of CTAs: Calls to action (CTAs) help your visitors nudge your visitors to take the next logical step in engaging with your website. They may leave altogether if they reach the end of a web page and don't know what to do from there.
Note that many of these are a direct result of your website design. As you progress with your website, consider opportunities to improve your bounce rate on each page.
3. Time Spent on Site
Closely related to bounce rate is time spent on site, which is precisely what it sounds like. Short visits indicate a lack of engagement, while more extended visits indicate that users have found something that catches their interest.
While your content strategy is pivotal in improving visitors' time spent on site, your website design can also contribute (particularly those elements that impact bounce rate).
As a benchmark here, the average time spent on site across all industries is 54 seconds. However, Contentsquare analyzed data from various industries and found that this figure varies widely by industry. Most notably, the average time is much higher for B2B companies than for B2C. 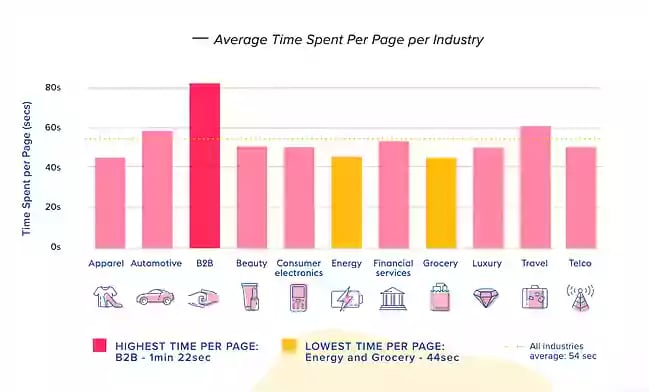
The lesson here: use your current website performance as the first and most important benchmark, and build from there.
4. Conversion Rates
Conversion rates are arguably the most critical metric in growth-driven design. After all, conversions are what help your business grow!
CTA Conversions
We need to break this down even further into two separate metrics:
CTA views: How many people are seeing your CTAs in the first place? They can't click what they don't see. Some ways to improve overall CTA views include changing the location of your CTA buttons (for example, moving them "above the fold") or adding more CTAs. For example, you might consider adding a CTA in the first few paragraphs of your blog posts so that people don't have to scroll to the bottom to find their first conversion opportunity.
CTA conversion rate: What percentage of CTA viewers click? This is critical because this represents a real conversion opportunity. If your CTAs get many views but few clicks, it's time to reconsider your call to action. Sometimes, a redesign can help; if your CTA isn't prominent enough, people might scroll right by it. In other cases, you'll need to think more deeply about whether your offer aligns with your website visitors' goals and needs, which goes back to understanding your buyer personas.
Landing Page Conversions
Landing page conversions are the bread and butter of your website because they're what (should) drive a significant proportion of your new contacts and leads. HubSpot says the average landing page conversion rate across all industries is 9.7%.
Does that seem like a lofty goal? HubSpot's data also provides some guidance on how you can improve:
Form length: Forms with the highest conversion rate only have three fields. (A caveat here: this may also yield a higher volume of less qualified leads.)
Content: Addressing buyer fears or reservations can increase conversions by up to 80%. Meanwhile, 30% of top-performing landing pages use video, 36% use testimonials, and 11% feature reviews.
Personalization: Personalized CTAs convert 202% better than default CTAs.
Percentage of MQLs and SQLs
We all know the old expression, "Garbage in, garbage out." The same applies to the contacts that your website is generating. If they're garbage, your sales team will get grouchy. Unlike Oscar, they don't like trash!
If you have a vast contact database but very few MQLs and SQLs, it's time to think about the conversion path you provide to visitors. A few questions to ask:
Does our website provide content for every stage of the buyer's journey? It's relatively common to have plenty of pages and offers for visitors in the awareness and consideration phases but be light on content for the decision phase.
Do we actively invite people to opt into ongoing communication? A great example is a pop-up form that invites people to subscribe to your blog. This seems like a simple tactic, but it can have incredible results because it allows people to continue interacting with your content and potentially move to the next phase of the buyer's journey.
Does our content truly line up with the needs of our buyer personas? If you continue to see poor conversion rates despite making other changes, it may be time to revisit your buyer personas. Perhaps your website misses the mark with messaging. Feeling stuck? One approach is asking a trusted customer or client to review your website. What are they looking for? Did they find it? What other information would be helpful?
6. Number of Closed Deals
Closing deals is undoubtedly the job of your sales team, right? Sure, but your website should do its fair share of heavy lifting. Ultimately, your website's primary purpose is to support and enhance your sales team's efforts.
A growth-driven website redesign includes elements that will help your sales team close the deal...before they even connect with a prospect. For example, your website content should include the following:
Responses to prospective customers' reservations, objections, or fears about engaging with your company
Social proof that a prospect is making the right choice (e.g., case studies, competitor comparisons, etc.)
A clear distillation of the business problem that your product or service solves and how that solution can work for your prospects
Keep these metrics at the center of your strategy as you move forward with your growth-driven website redesign. They'll give you the data you need to make more informed decisions and realize your company's growth goals.
Want to know how your current website stacks up? Our free online website grader provides plenty of valuable insights.


Leave a Comment
Have thoughts on this article?
Share your feedback, ask questions, or join the discussion with our community.